Material & Methods
Taxonomy and the naming of Mimulus (formerly Scrophulariaceae) have been altered. In using molecular markers (Beardsley & Olmstead, 2002) evidence has been gained for placing Mimulus into the Phrymaceae. According to Thompson (1993, the taxon Mimulus aurantiacus signifies the entire complex consisting of at least 9 subspecies. In this study, we have decided to adopt the nomenclature of Tulig & Nesom (2012) with a slight change. For this study the putative Diplacus x australis is regarded as Diplacus australis only. Here the corolla color is either orange-yellow, light apricot, buff, or white. When a plant has red to scarlet corollas, the entity is regarded as Diplacus puniceus. Since the terms «hybrid zone» as well as «hybrids» are limited to sexual interactions between Diplacus entities and do not comply with the gradual character shift of individual plants demonstrated here, we use the terms «transition zone» and «transitional plants» instead. We are aware that individuals in transition do freely interbreed in the field. Hybrids could also appear in a transition zone.
Field Surveys
During 38 field trips (65 weeks) in April and/or May from 1995 until 2015 as well as in January from 1999 until 2010 a total of 231 populations of D. australis, D. puniceus and the related intermediates were recorded in the Southern Californian Counties of Orange, Riverside, and San Diego. A selection of 75 populations was scored up to five times, namely in 1996 (April/May), in 1999 (April), 2003 (April/May), 2010 (May), and finally 2015 (April/May). The sites were found along roads as well as foot trails and mapped using a mapping-grade GPS unit. At each site twenty (thirty-six) recently opened flowers from twenty (thirty-six) different individuals were evaluated. Flowers were randomly collection from 40 plants, one after the other, along a virtually straight line. Thereafter, 20 (or 36) flowers were randomly removed from the collection bag. The color of the lower corolla lobe was then assessed by comparing it with the most saturated tints of the color chart of the Methuen Book of Colour (Kornerup & Wanscher, 1983). This yielded a color value in Methuen units. The related coordinates (L*a*b) are shown in (CIE see below). As flower color is the most conspicuous, distinctive feature (Beeks, 1962), it was used as a transition zone marker. The criterion for transition was a mean value between 5.55 and 9.1 Methuen units of 20 (or 36) flowers collected from one and the same population. Significance of median flower color changes by time at a given site was determined by Wilcoxon/Kruskal-Wallis tests, and the related p-values were assessed by chi-square distribution. For statistic computing the software package R.app GUI 1.35 from R Foundation for Statistical Computing, 2010 was used. Furthermore, long-term observations indicate that flower color, if changing to red, increases by 0.3 to 0.5 units per year at the most dynamic spots and thus, a real shift to higher Methuen units would be recognized in a population after three years at the earliest.
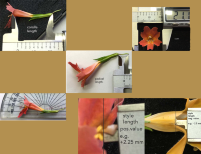
From each sampled flower the following floral characteristics were measured: the angle of the floral tube, the length of the pedicel, the position of the stigma and the floral length and width (figures. above). Additionally, since 2002 the color was measured with the hand-held spectro-colorimeter PANTONE®ColorCue2 x-rite model 200. The color was assigned to the L*a*b color system. The [a] component (green/red axis) and [b] component (blue/yellow axis) can range from -120 to 120.

DATA (ed July 2017)
 | Transect B1_B6 Field Data (2012 & 2017) B1B612_17Fld.xls (170.5KB) |
| B1B612_17Fld.xls (170.5KB) |
San Fernando Pass 2012 Flower Data N=37
 | SFlonTr12.csv (1.51KB) |
Further field-data and lab-data sets are freely available on request.
outlook (will follow soon)