Population Dynamics in Diplacus
A new Kind of Analyses
A New Kind of Analyses
If one examines a biological system in an evolutive way, one usually uses conventional selection-theoretical tools. The statement is, therefore, always related to this theory and physically not objective. One must, therefore, start from the object and describe it as physically as possible. One has to build a tool from the ground up that makes physical statements possible in the first place. A phase space is an appropriate tool. In phase space, one can integrate all data of a living being provided the data density is sufficiently compelling. The statement one makes with such a phase space is always instantaneous probability states.
Example:
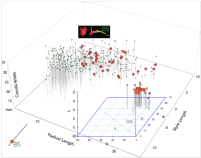
A) A large number of color locations of the corollas (in the area of Fig1) of Diplacus puniceus, Diplacus australis, and the mixed forms are determined. However, the values per individual are measured only once, and no mean values are used.
B) With the help of the statistics program R a phase plot is made.
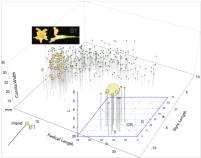
C) In this phase space, a point cloud (yellow points) is visible, which is more or less dense. The density per cuboid thus varies depending on the origin of the rennet measured values. Outside the point cloud, the density is almost zero. In the area around Y and R, the density is maximally high. Such places with maximum point density are now called attractors. The density of the point cloud decreases exponentially with the distance to the attractors.
Thus the relative maxima have already been found empirically. These points are extraordinary. By the way, the model can be extended by further levels with the condition that the data density for each level is sufficiently high. (later)
The Color Phase Space
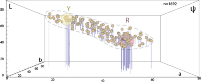
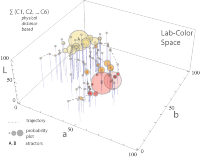
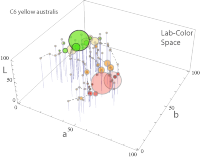
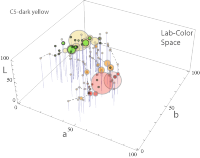
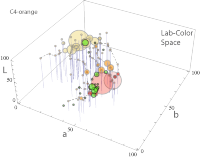
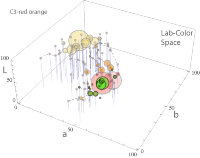
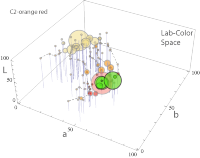
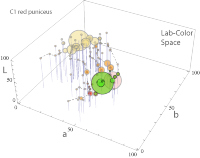
Fig. Stepwise Floral Color Shift along the Transect B1 ... B6
The figure shows the frequency distribution of color tones (Lab) in a Lab color space. The point A contains forms of the Diplacus australis with yellow flowers, the point B is occupied by the types of the red-flowering species Diplacus puniceus. Along an east-west section, 216 plant data from 6 populations were recorded. Striking is the frequency distribution, which decreases sharply with the distance to the respective maximum. Also, paths what we name trajectories are to be identified. We call points A and B as attractors.
Figure 1A under Diplacus 1 shows a transect (B1 ... B6). - If one clicks on the right arrow in the graphic above, one will see the color distribution (light green) beginning with B1 yellow and ending with B6 red spatially distributed. A temporal change of a transitive population at one site looks, by the way, very similar. However, this takes 15 to 20 years to complete.
Stepwise Floral Character shift along the Transect B1 ... B6
Combining the lab phase space with the space of three further variable flower characteristics results in an informative distribution. The flower characteristics change gradually from the yellow to the red form (swipe or enlarge).
Discussion
The present form of representation in a phase space of extensive data packets now in connection with transect plants clearly brings a leap in quality. The data are presented more precisely and objectively, the results can be readily displayed graphically, and you can also standardize (for example, point frequency). Besides, the phase space can be extended (e.g., for molecular genetic or genotypic data).
Modern colorimeters are very accurate, they are more reliable than the color perception of the human eye. - It becomes immediately apparent that the color deviation from the mean value is minimal in an adapted population of red-flowered Diplacus puniceus.
The phase space can not only give information about the total variance, but it also helps in the evaluation of intermediate forms and gives information about the dynamic change of populations.
In the present case, the phase space does not support the hybridization hypothesis. It seems much more probable that one form (yellow) is abandoned in favor of a red shape, and the new structure is gradually approached. It is evident that not only populations go through this process, but also every individual participates. At the unique point (attractor point), the form seems to be dynamically stable, what seems not to be true outside of this point.
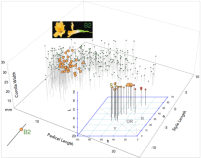
Dynamics I
Data from 6 populations situated along a W-E transect (60 km) from red to yellow morphs were sampled in 2012, 2017 & 2022. In between stages build up a cloud (orange colored dots) denser in 2012 than in 2017 and fades slowly out in 2022.
Interpretation:
• A slow transition dynamics are indicated here but seem to end between 2017 and 2022. There is hardly seen a transition zone over the whole range. However, the local transition can still be seen in multiple places.
About the Diplacus planted on roadside verges:
Diplacus longiflorus plants South of Ortega Hwy (74) can spontaneously transform into puniceus-like forms in 20 years.
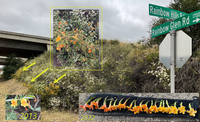
Roadside Diplaus longiflorus plants tend to shift in color and shape over time (~20 yrs).
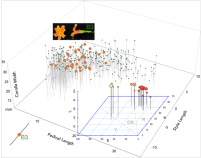
DII
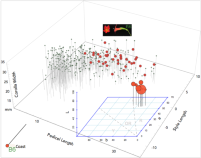
By monitoring two populations of color reads of its flowers during > 15 years, the single color read (L, a, b) in each case approaches point ⋀2. The distance between the mean color read (dark grey bubble) and ⋀2 tends to minimize if the monitoring period is just long enough. The endpoint ⋀2 of transition is approximately the same value, unseen of its transect, population or individual plant origin.
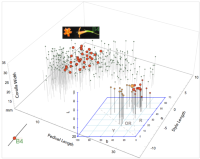
Dynamics III
Transgenerational inheritance means that these two individuals (T27 & T30) were self-pollinated three times in different years, and the variety of the offspring individuals (N=36) were plotted in the L*a*b phase space. - Also here one gets an accumulation of red dots finally at ⋀2 in both cases.
T27 as well T30 plants are plants in transition.
This is T27 photographed in three different transitional stages
Dynamics IV
What is epi - Mendelian inheritance?
The Mendelian inheritance is known and can be applied to the two morphs. Crossing a yellow-flowering and a red-flowering Morph from Diplacus gives the F1 generation uniform orange flowers. Inbred lines of F1, segregates in the F2 generation. One can cross F1 plants either with the yellow or then the red morph. Both parental morphs are self-compatible and cross-fertile. So far, so good. The different resulting morphs (F1, F2, F1xY, F1xR) are all stable in time.
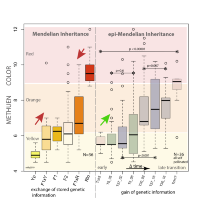
In nature, however, within a broad transition zone, morphs can be observed that are temporally unstable and change their (epi-) genetic information in a time-dependent manner. Starting from the yellow morph (green arrow), they slowly turn into an orange morph and then into a red one. When inbred lines are performed from transitive stages every fifth year, one gets descendants that vary more or less depending on the duration of the transition. The distribution of the variation is very similar to the Mendelian distribution(grey boxplots). We call this process epi-Mendelian inheritance. At the end stage (after15-20 years), a final form with homozygous red morphs is reached.
To apply Mendel's laws, however, one always starts from two closely related parent forms (red arrows).
The time-based epi-Mendelian process leads to evolution solely by acquiring genetic information (gain of genetic information).
Conclusions:
1) In the long run, every single yellow plant of Diplacus australis within an active transition zone reaches the ⋀2-color tone that is finally a darker red (a=53; b=33; L=43).
2) The acquired new state is stored genetically somehow in the plant tissue cells.
3) Charles Darwin's concept of speciation by natural selection is 160 years old and will soon be obsolete and should be replaced by a physical model. Explaining evolution by variation and selection alone is a nuisance today in which every smallest molecule can be studied. Of course, only the analytic approach is wrong - the survival of the fittest, if one means the optimized form - is correct, but the underlying mechanisms are a nineteenth-century fantasy emanating from embarrassment. Otherwise one would have to recognize God as the Creator. One did not want that anymore. With a little effort, however, one can find a better physical theory that is good enough.
In addition, the selection theory or hypothesis can be elegantly falsified with the above findings because a generation change is not required. It works without it! But that was an elementary condition for Darwin's theory.
Excellent LAB-Color Space of over
two thousand scanned floral tissues
(Mathematics).
 | AllDiplBubble.cdf (258.28KB) |

